Resources & Guides
How to Perform a Sales Data Analysis: A Step-by-Step Guide for 2026
Sales data analysis is the process of collecting and interpreting data from your sales activities to understand performance, identify patterns, and make better decisions.
Every B2B organization tracks revenue, pipeline, and conversion rates. These numbers tell you what happened. They rarely tell you why.
This guide covers how to perform a complete sales data analysis in 2026, from the foundational metrics every team should track to the practice of analyzing sales conversations for the qualitative intelligence that dashboards cannot provide.
What Is Sales Data Analysis?
Sales data analysis examines both quantitative data (revenue, deal size, win rates, pipeline velocity) and qualitative data (buyer feedback, objection patterns, competitive mentions) to provide a complete picture of sales performance.
When done well, it answers questions like: Why are deals closing faster in one segment than another? What objections appear most frequently in lost deals? Where in the sales cycle do deals stall? How do buyer conversations differ between won and lost opportunities?
There are four types that build on each other. Descriptive analysis shows what happened. Diagnostic analysis explains why. Predictive analysis forecasts what will happen next. Prescriptive analysis recommends what to do about it.
Key Sales Data Metrics to Track
Revenue Metrics
Total revenue, monthly and annual recurring revenue (MRR/ARR), average deal size, and revenue by segment. These form the foundation. Track them over time to spot growth trends and the impact of strategic changes.
Pipeline Metrics
Pipeline value, pipeline velocity, and stage conversion rates. Velocity is calculated by multiplying deals by average deal size and win rate, divided by sales cycle length. Drop-offs between stages reveal where friction exists.
Performance Metrics
Win rate (overall and by segment, rep, and time period), sales cycle length, and activity metrics like meetings held and proposals delivered. Correlate activity patterns with outcomes to identify what top performers do differently.
Customer Metrics
Customer acquisition cost (CAC), customer lifetime value (CLV), and churn rate. A healthy CLV-to-CAC ratio is typically 3:1 or higher.
Qualitative Metrics
This is where most guides stop. But numbers alone cannot explain why deals are won or lost.
Qualitative metrics from sales conversations include specific buyer objections, the language customers use to describe their problems, competitors mentioned during evaluation, and the internal barriers buyers describe when decisions stall. Tracking these alongside quantitative metrics transforms sales analysis from measurement into intelligence.
How to Perform a Sales Data Analysis: Step by Step
Step 1: Define Your Objectives
Identify what you want to learn before collecting data. Are you evaluating overall performance? Understanding why deals are lost? Assessing competitive dynamics? Your objectives determine which data to prioritize.
Step 2: Collect and Centralize Your Data
Sales data lives across CRM platforms, marketing tools, finance systems, and communication logs. Centralize it into a single system for holistic analysis. For teams that record sales calls, conversation data is an increasingly valuable additional source.
Step 3: Clean and Prepare
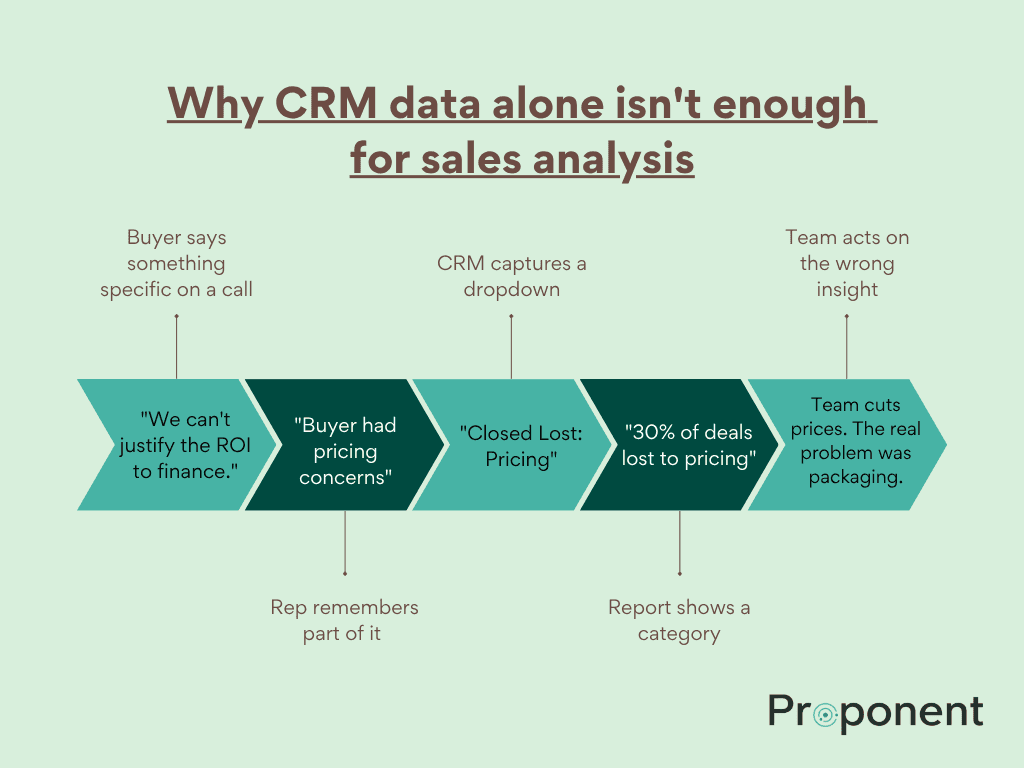
Remove duplicates, standardize formats, fill gaps, and flag incomplete records. Pay special attention to CRM fields like close reasons and competitor involvement. Research consistently shows that CRM lost-deal reasons often reflect what reps remember to log, not what actually happened.
Step 4: Segment Your Data
The most actionable insights come from segmentation: by deal outcome (won vs. lost), by customer segment (enterprise vs. mid-market), by sales rep, by time period, and by competitor involvement.
Step 5: Analyze Quantitative Patterns
Compare win rates across segments. Analyze conversion rates by pipeline stage. Track changes in deal size and cycle length. Look for correlations between activity patterns and outcomes. Use dashboards and visualizations to make patterns visible.
Step 6: Analyze Qualitative Patterns from Sales Conversations
This is what separates comprehensive sales data analysis from basic reporting.
Quantitative data tells you that 35% of mid-market deals were lost last quarter. Conversation analysis tells you that eight of those deals mentioned the same competitor, six raised pricing ambiguity, and four stalled because the buyer could not justify ROI internally.
Key patterns to look for in conversations:
Objections that appear in lost deals but not won deals. These indicate systemic positioning or pricing gaps.
How buyers describe competitors. This often differs significantly from what appears in battlecards.
The specific language buyers use to describe their problems. This language is invaluable for messaging because it reflects how buyers think, not how the selling organization talks.
Where buyer sentiment shifts during the conversation. Identifying the moment a deal starts going off track provides actionable guidance for sales training.
Which stakeholders are engaged versus absent. B2B purchases now involve an average of 22 people. Understanding who is in the conversation and who is missing reveals alignment risks.
Step 7: Connect Insights to Actions
Every insight should map to a specific recommendation. Pricing ambiguity recurring in lost deals? Restructure pricing communication. A competitor winning in a specific segment? Revise positioning for that segment. High drop-off between demo and proposal? Improve follow-up processes.
Step 8: Build Continuous Feedback Loops
The most effective programs are not quarterly projects. They are continuous systems: daily monitoring of key metrics, weekly pipeline reviews, monthly win/loss analysis, and quarterly strategic deep dives. The data set grows with every deal and every conversation, producing compounding advantage over time.
Tools for Sales Data Analysis
CRM Platforms (Salesforce, HubSpot): Primary repository for deal data and pipeline information. Built-in reporting covers basic descriptive analysis.
Business Intelligence Tools (Tableau, Power BI, Looker): More sophisticated analysis, visualization, and cross-referencing across multiple data sources.
Sales Analytics Platforms (Clari, InsightSquared): Specialized analysis of forecasting, pipeline management, and performance tracking.
Conversation Intelligence Platforms: The fastest-growing category. These analyze recorded sales calls to extract qualitative patterns. Traditional tools were built for sales coaching. Newer platforms serve product marketing, enablement, and product teams by connecting conversation data to CRM context.
Common Mistakes to Avoid
Relying exclusively on CRM data. CRM captures what reps log, not what happened. Supplement with conversation analysis.
Skipping segmentation. A healthy overall win rate can hide that mid-market deals close at half the rate of enterprise deals.
Measuring activity instead of outcomes. Calls made and emails sent don't correlate linearly with results. Focus on win rates, conversion rates, and deal velocity.
Ignoring qualitative data. Numbers describe what happened. Conversations explain why.
Treating analysis as a one-time project. Point-in-time analysis ages quickly. Build continuous feedback loops instead.
Getting Started
Start small. Centralize your CRM data, set up dashboards for key metrics, and establish a weekly review cadence.
Then pick 10-15 recently closed deals and compare what the CRM says with what actually happened in the sales conversations. The gap between those two sources will demonstrate why conversation analysis matters.
The teams that consistently outperform are not the ones with the most data. They are the ones who turn data into understanding, and understanding into action.


